Azure Service Health Issue JIRA Integration
Introduction
I’ve been asked to develop a solution that manages JIRA Incidents in JIRA Service Management for Azure Service Health Issues.
Azure Service Health Issues
Azure Service Health notifies you about Azure service incidents and planned maintenance so you can take action to mitigate downtime.
You can configure Alerts for the following Service health events (Service issues, Planned Maintenance, Health advisories and Security advisories).
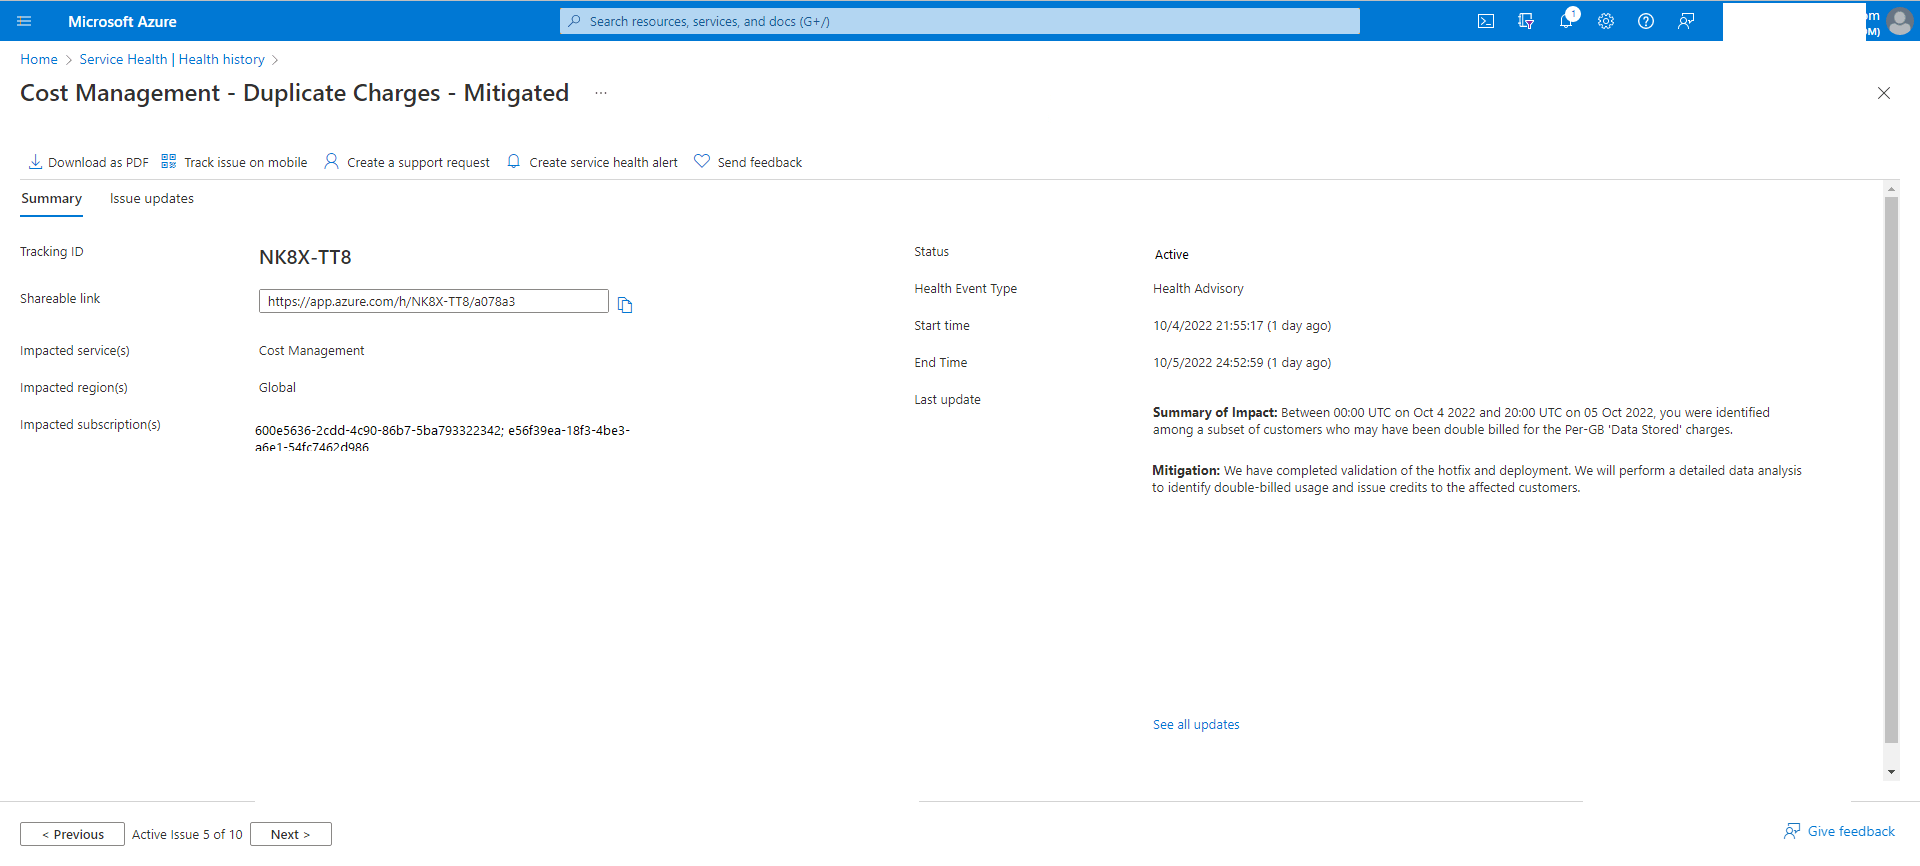
Here is an example of an Azure Service Health Alert from the Azure Portal.
Service health notifications are stored in the Azure activity log. Given the large volume of information stored in the activity log, there is a separate user interface to make it easier to view and set up alerts on service health notifications.
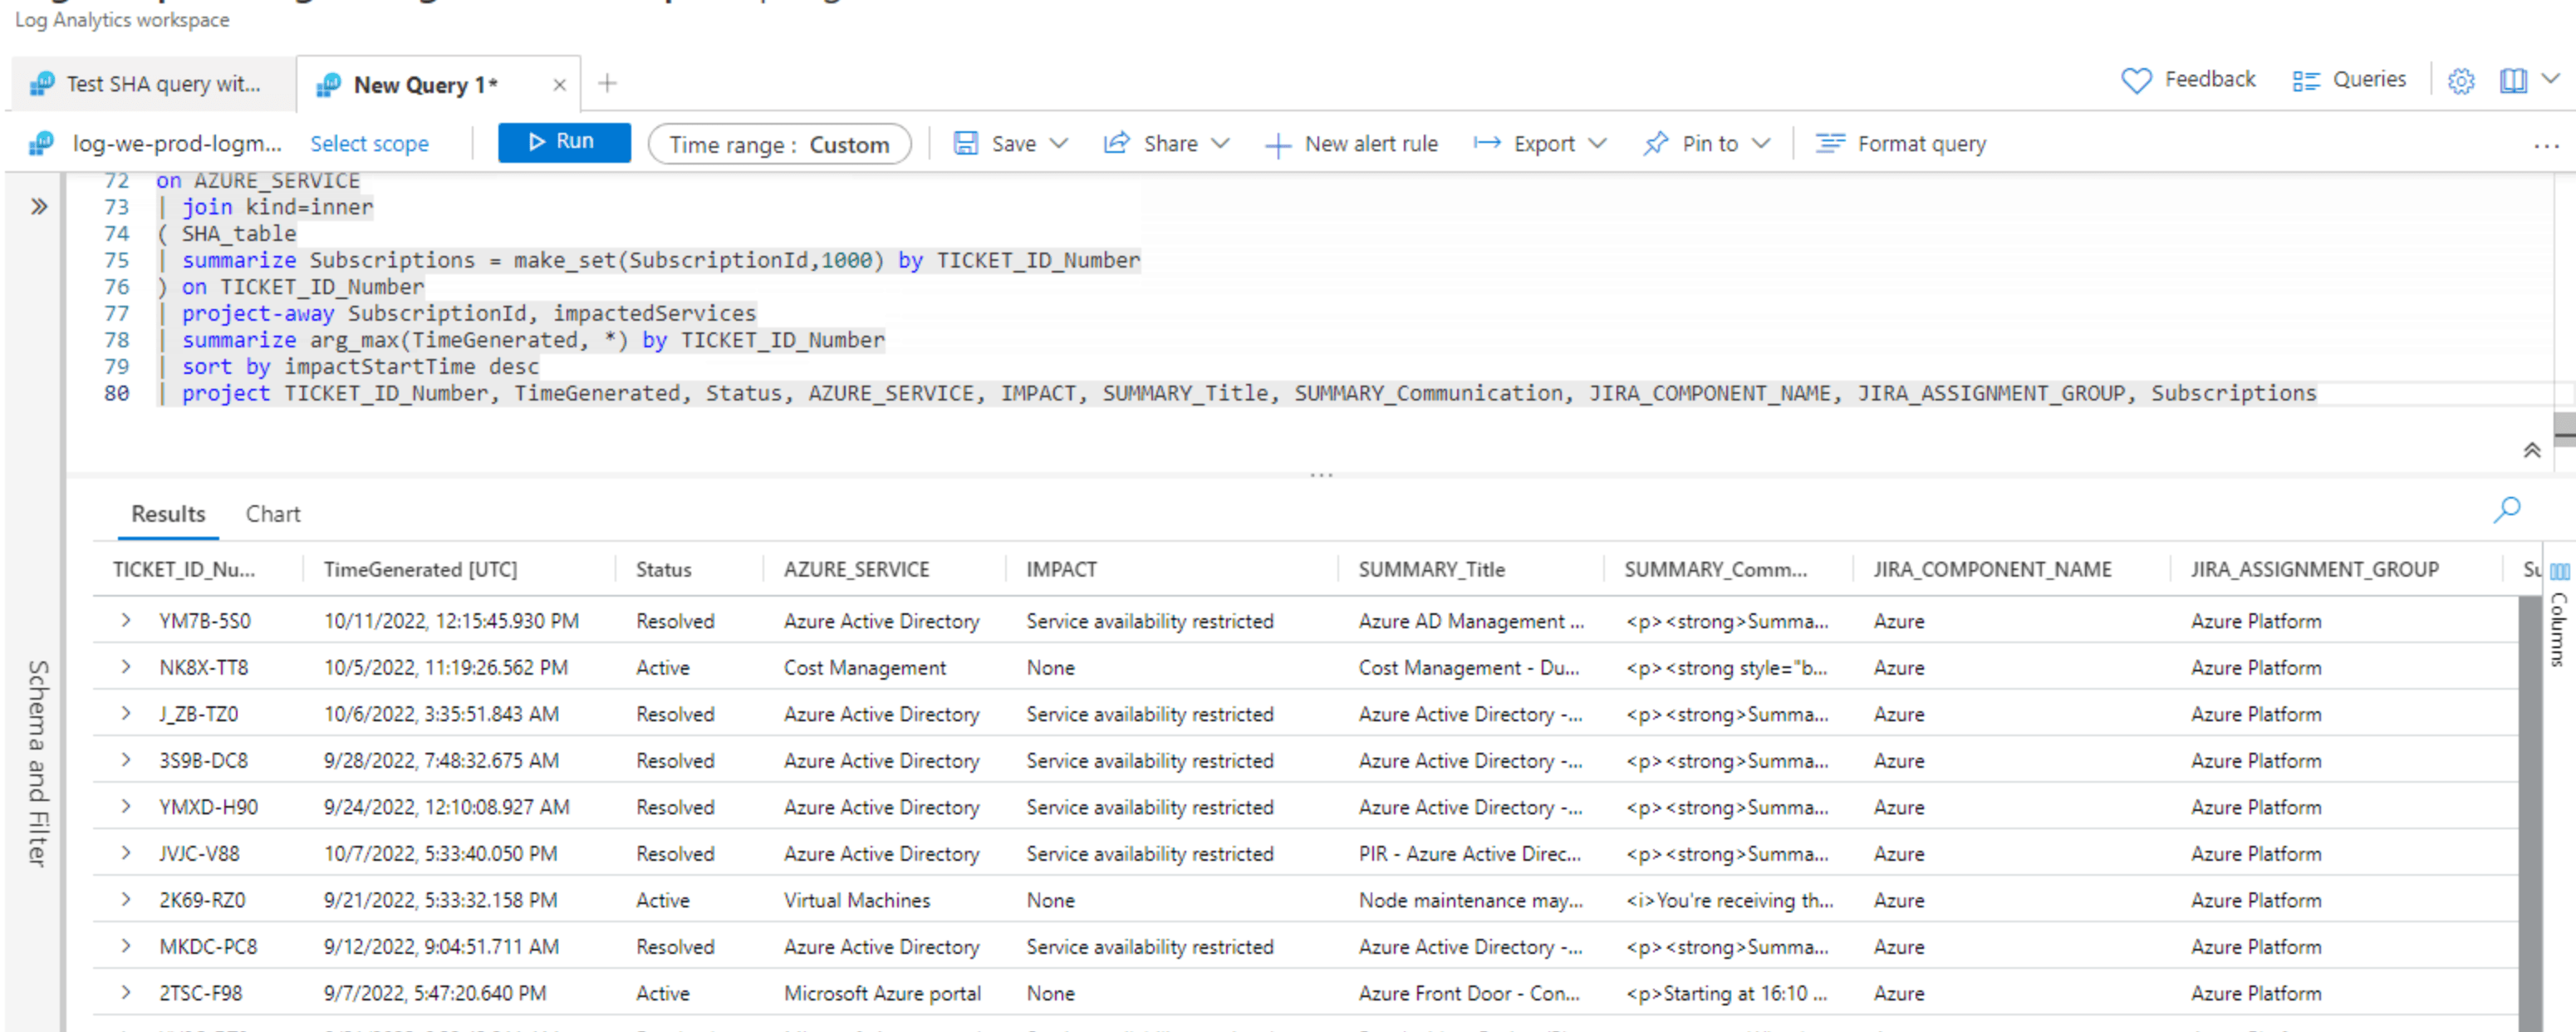
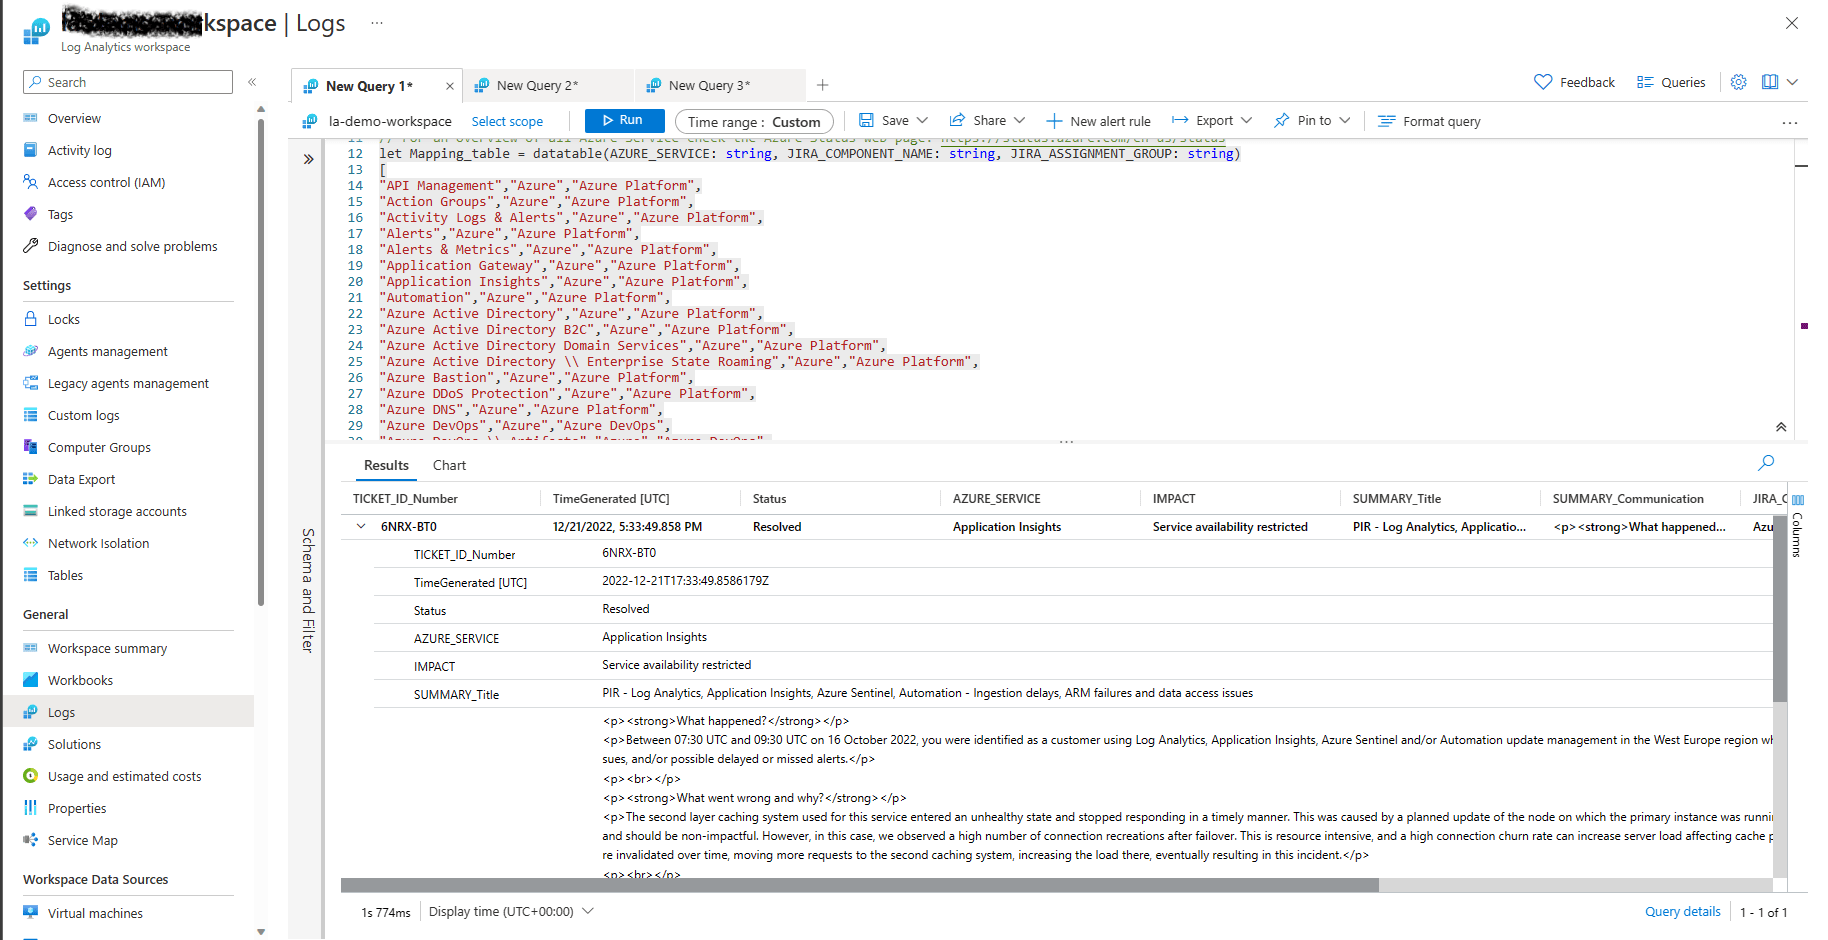
Here is a screenshot of the same Azure Service Health Alert Issue information stored in the Log Analytics Workspace for each of the impacted Azure Subscriptions.
At the moment there are multiple ways to send these Azure Service Health Alerts to existing notification systems, being:
All of these are using the Azure Action Group Webhook Action Type.
In this blog post I’m going to explain how you can use an Azure Logic App as an interface from the Azure Monitor Alert Rule (and Action Group) and JIRA Service Management to have a JIRA Incident created.
Using an Azure Logic App Flow enables you to add logic, like populating the required JIRA Incident properties. E.g. Affected Hardware, Asignment Group etc.
This is specifically helpful when you have added custom fields to the JIRA Incident. The end goal is to have for each of the Azure Service Health Alerts an JIRA Incident being created and assigned to the correct assignment group.
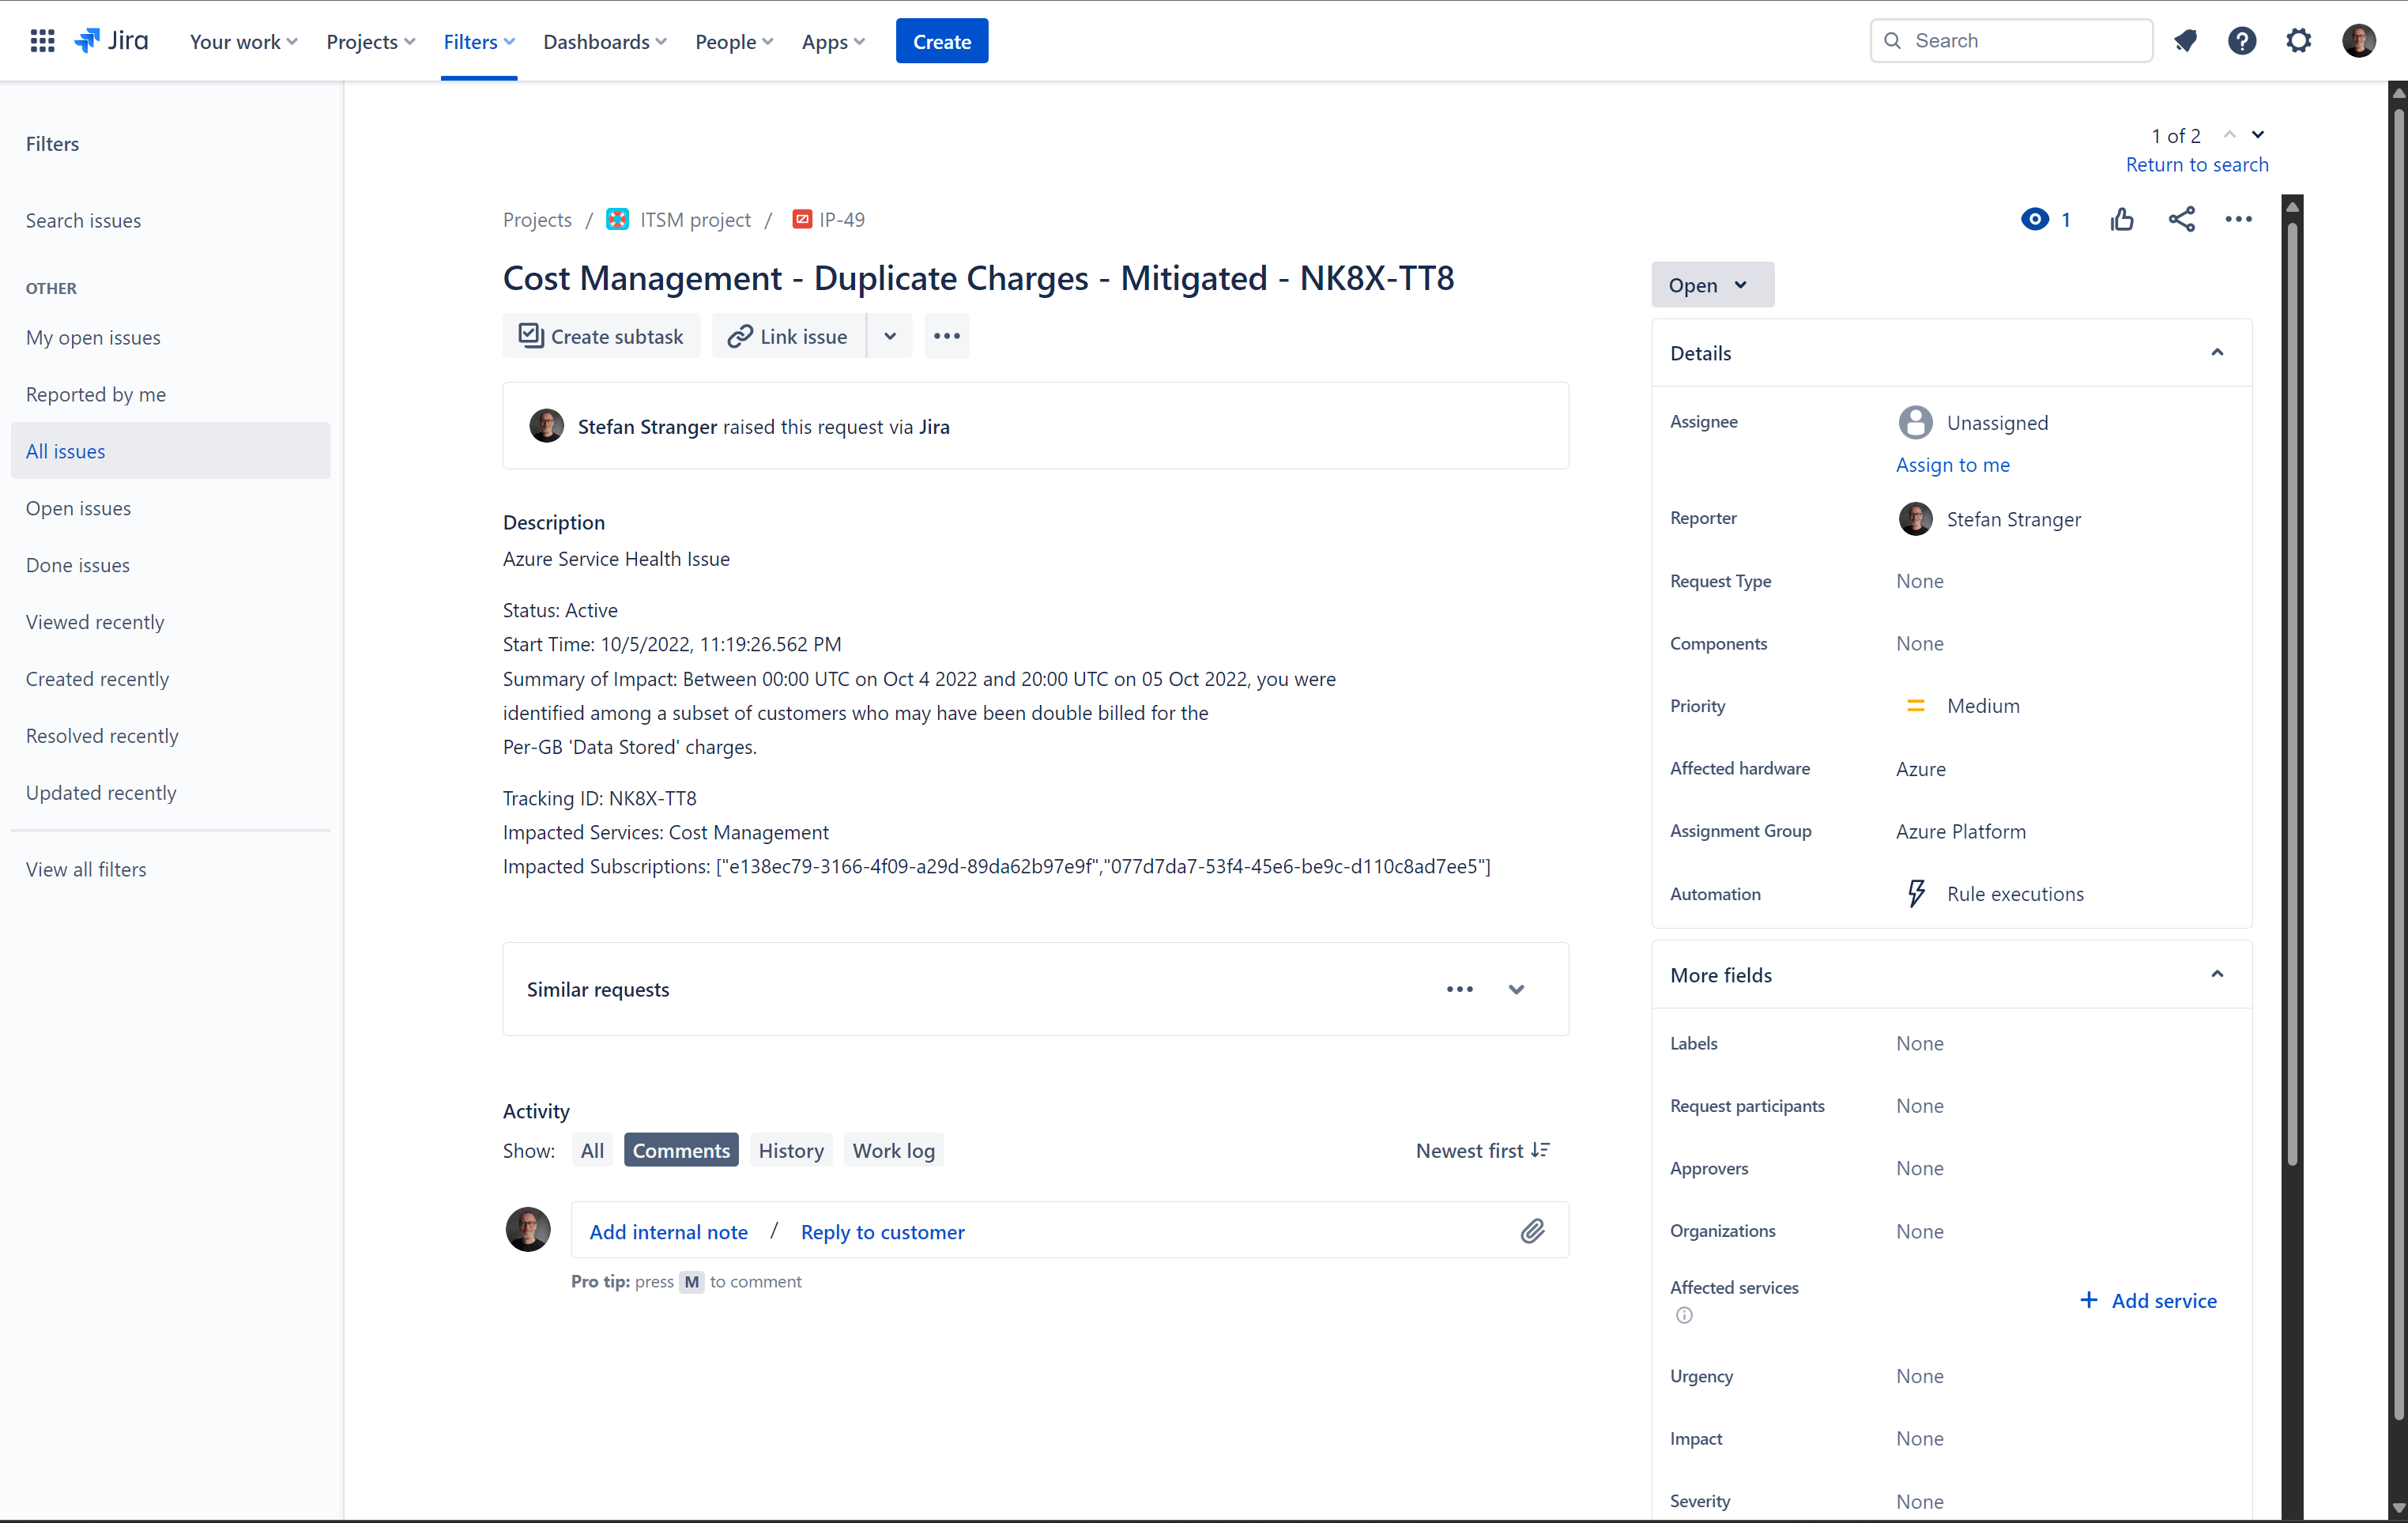
The following JIRA Incident should be created on the above Azure Service Health Issue with title “Cost Management - Duplicate Charges - Mitigated - NK8X-TT8”.
Besides the Description field also the fields Affected Hardware and Assignment Group (custom field) are used when creating a JIRA Service Health Alert Incident.
JIRA Service Management
Jira Service Management is a tool to help you track your tickets, communicate with customers, and resolve requests.
In this example we created a new Custom Field called Assignment Group. You can find more information on how to create this here: JIRA Assignment Groups
In the Logic App workflow we are using both the Logic App JIRA Connector and JIRA REST API calls.
For the JIRA REST API calls you need to create JIRA API token.
This can be used to create a basic authentication header for the JIRA REST API calls.
Example JIRA REST API calls used in the Logic App Workflow
The following JIRA REST API calls can be used to collect all information neccesary in the Logic App Workflow.
Get JIRA Fields
1
2
3
4
curl -X GET \
   --header 'Authorization: Basic [base64 encoded string]' \
   --header "Content-Type: application/json" \
   'https://[your-domain].atlassian.net/rest/api/3/field' | jq -C
This provides you input about any (custom) fields you can use in your Logic App Workflow JIRA REST API calls.
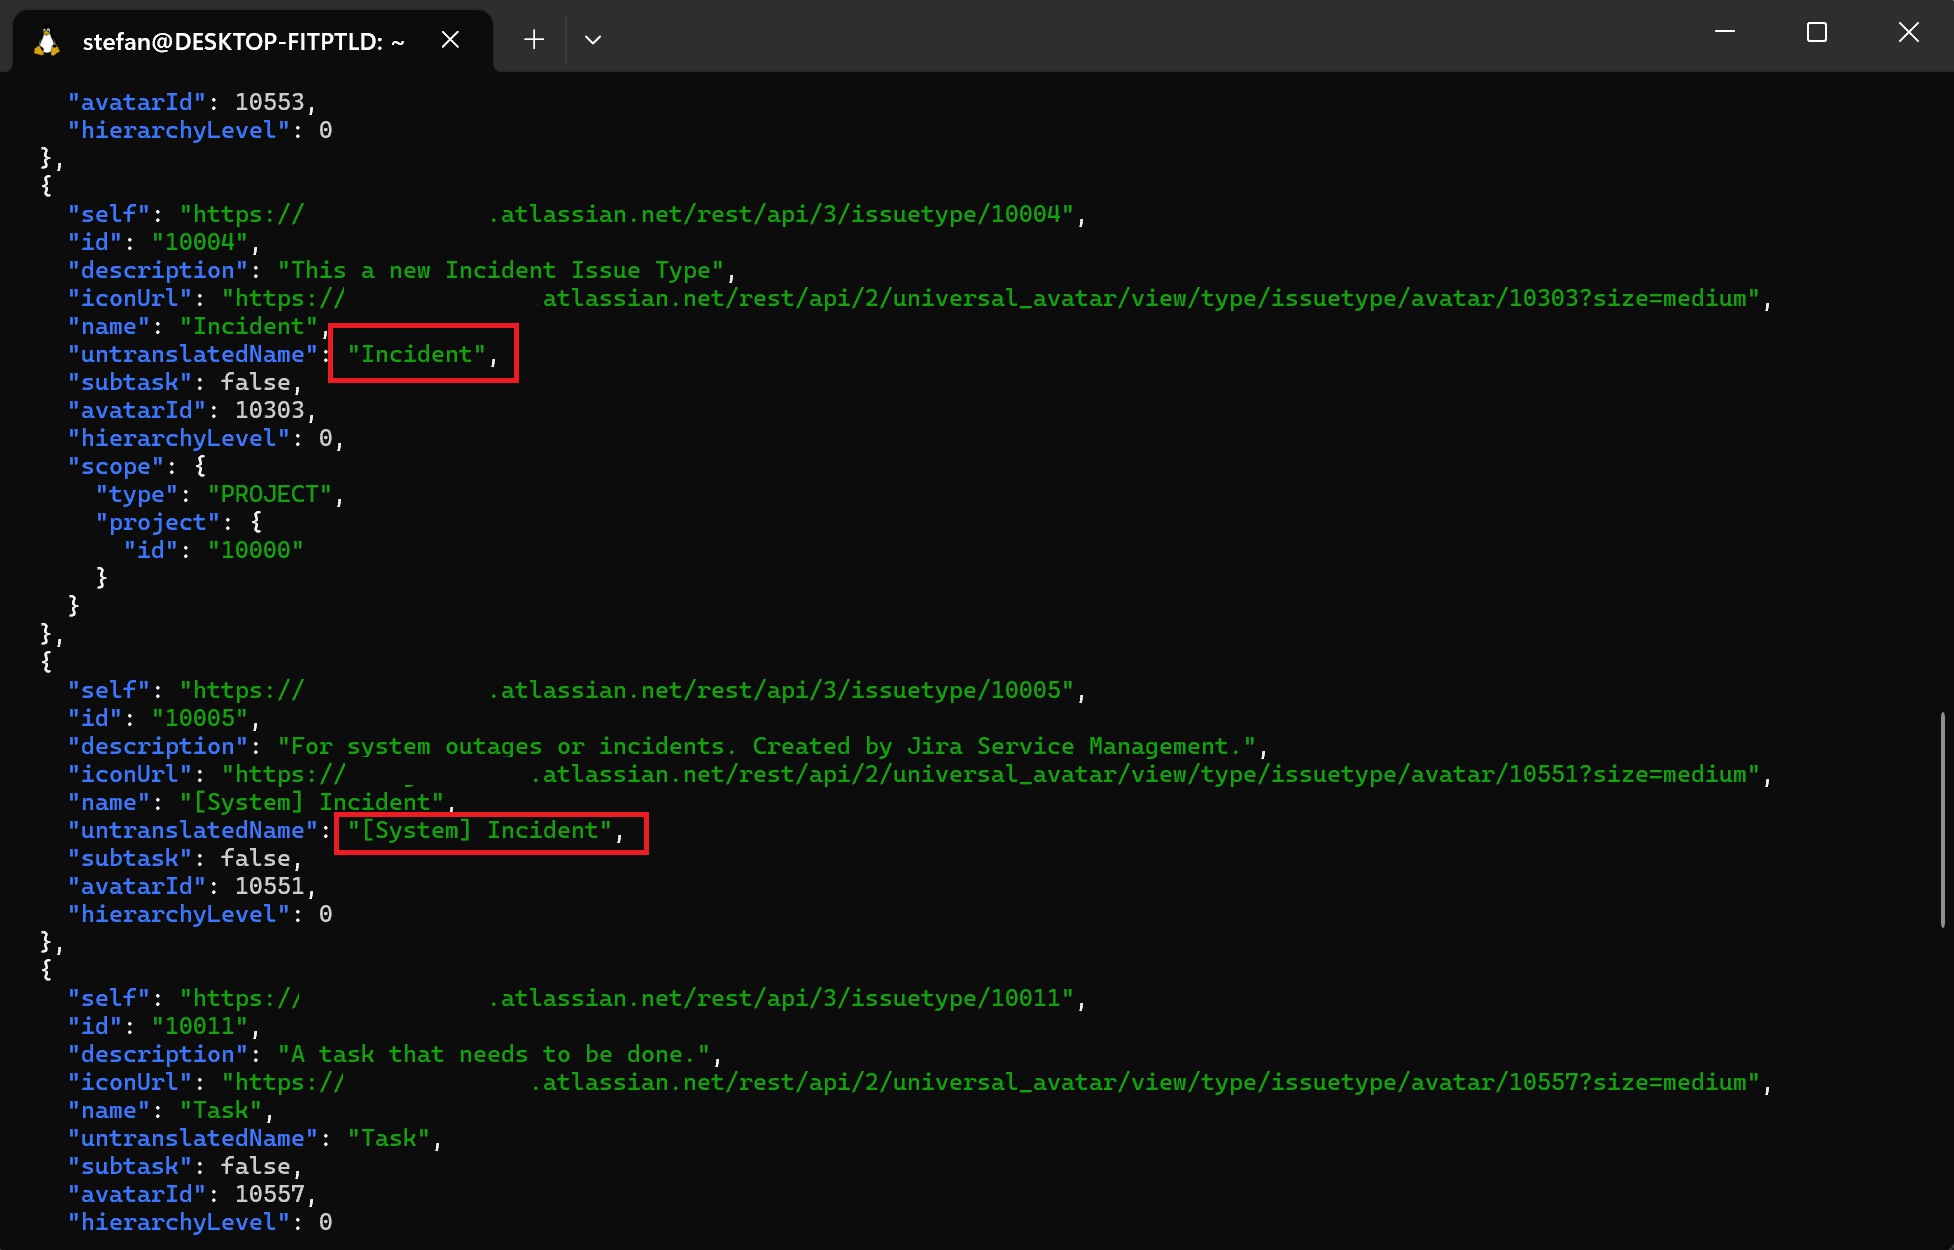
Get JIRA Issue Types
1
2
3
4
curl -X GET \
   --header 'Authorization: Basic [base64 encoded string]' \
   --header "Content-Type: application/json" \
   'https://[your-domain].atlassian.net/rest/api/3/issuetype | jq -C
Log Analytics Query
The following Log Analytics query is being used to retrieve Azure Service Health Alerts.
1
2
3
4
5
6
7
8
9
10
11
12
13
14
15
16
17
18
19
20
21
22
23
24
25
26
27
28
29
30
31
32
33
34
35
36
37
38
39
40
41
42
43
44
45
46
47
48
49
50
51
52
53
54
55
56
57
58
59
60
61
62
63
64
65
66
67
68
69
70
71
72
73
74
75
76
77
78
79
80
81
82
// Azure Service Health Issue JIRA Integration Query
// Date: 22-12-2022
// Version: 1.0
// Description: This query should be use in an Azure Monitor Alert Rule to trigger the Logic App called ServiceHealth Alerts
// Mapping table to link an impacted Azure Service Health Service with the JIRA Assignment Group
// Required JIRA Properties:
// - Description
// - Summary
// - Assignment Group (custom field)
// - Components (make sure you have created Components for each of the Azure Services)
// For an overview of all Azure Service check the Azure Status web page: https://status.azure.com/en-us/status
let Mapping_table = datatable(AZURE_SERVICE: string, JIRA_COMPONENT_NAME: string, JIRA_ASSIGNMENT_GROUP: string)
[
"API Management","Azure","Azure Platform",
"Action Groups","Azure","Azure Platform",
"Activity Logs & Alerts","Azure","Azure Platform",
"Alerts","Azure","Azure Platform",
"Alerts & Metrics","Azure","Azure Platform",
"Application Gateway","Azure","Azure Platform",
"Application Insights","Azure","Azure Platform",
"Automation","Azure","Azure Platform",
"Azure Active Directory","Azure","Azure Platform",
"Azure Active Directory B2C","Azure","Azure Platform",
"Azure Active Directory Domain Services","Azure","Azure Platform",
"Azure Active Directory \\ Enterprise State Roaming","Azure","Azure Platform",
"Azure Bastion","Azure","Azure Platform",
"Azure DDoS Protection","Azure","Azure Platform",
"Azure DNS","Azure","Azure Platform",
"Azure DevOps","Azure","Azure DevOps",
"Azure DevOps \\ Artifacts","Azure","Azure DevOps",
"Azure DevOps \\ Boards","Azure","Azure DevOps",
"Azure DevOps \\ Pipelines","Azure","Azure DevOps",
"Azure DevOps \\ Repos","Azure","Azure DevOps",
"Azure DevOps \\ Test Plans","Azure","Azure DevOps",
"Azure Firewall","Azure","Azure Platform",
"Azure Firewall Manager","Azure","Azure Platform",
"Azure Information Protection","Azure","Azure Platform",
"Azure Migrate","Azure","Azure Platform",
"Azure Red Hat OpenShift","Azure","Azure Platform",
"Azure Reservations","Azure","Azure Platform",
"Azure Search","Azure","Azure Platform",
"Azure Sentinel","Azure","Azure Platform",
"Azure VMware Solution by CloudSimple","Azure","Azure Platform",
"Container Registry","Azure","Azure Platform",
"Data Lake Analytics","Azure","Azure Platform",
"Event Hubs","Azure","Azure Platform",
"ExpressRoute","Azure","Azure Platform",
"ExpressRoute \\ ExpressRoute Circuits","Azure","Azure Platform",
"Key Vault","Azure","Azure Platform",
"Load Balancer","Azure","Azure Platform",
"Media Services \\ Streaming","Azure","Azure Platform",
"Microsoft Azure portal","Azure","Azure Platform",
"Mobile Engagement","Azure","Azure Platform",
"Scheduler","Azure","Azure Platform",
"Stream Analytics","Azure","Azure Platform",
"Time Series Insights","Azure","Azure Platform",
"Traffic Manager","Azure","Azure Platform",
"VPN Gateway","Azure","Azure Platform",
"Virtual Machines","Azure","Azure Platform",
"Cost Management","Azure","Azure Platform"
];
let SHA_table = AzureActivity
| where CategoryValue == "ServiceHealth"
| extend event = parse_json(tostring(parse_json(Properties).eventProperties))
| where event.region in ("Global", "North Europe", "West Europe")
| where ActivityStatusValue == "Active" or ActivityStatusValue == "Resolved"
// All Azure Service Health Events with IncidentType Incident have an impact of 'Service Availability restriced' the rest is None.
| extend IMPACT = case(event.incidentType == "Incident", "Service availability restricted", "None")
| project PROJECT= "ITSMSD", LABELS=CategoryValue, TICKET_ID_Number=tostring(event.trackingId), TICKET_ID_Source= "Azure Monitoring", AZURE_SERVICE=tostring(event.service), IMPACT, Level, ISSUE_TYPE="Incident", SUMMARY_Title=event["title"], SUMMARY_Communication=tostring(event.communication), Status=ActivityStatusValue, impactStartTime=tostring(event.impactStartTime), SubscriptionId, impactedServices=event.impactedServices, TimeGenerated;
SHA_table
| join kind=inner(
    Mapping_table
)
on AZURE_SERVICE
| join kind=inner
( SHA_table
| summarize Subscriptions = make_set(SubscriptionId,1000) by TICKET_ID_Number
) on TICKET_ID_Number
| project-away SubscriptionId, impactedServices
| summarize arg_max(TimeGenerated, *) by TICKET_ID_Number
| sort by impactStartTime desc
| project TICKET_ID_Number, TimeGenerated, Status, AZURE_SERVICE, IMPACT, SUMMARY_Title, SUMMARY_Communication, JIRA_COMPONENT_NAME, JIRA_ASSIGNMENT_GROUP, Subscriptions
You need to adjust above query based on your own requirements.
When running above Kusto query within the Log Analytics workspace the following record is being returned.
If we look at the outputs the following properties are being returned:
- TICKET_ID_Number
- TimeGenerated
- Status
- AZURE_SERVICE
- IMPACT,
- SUMMARY_Title
- SUMMARY_Communication
- JIRA_COMPONENT_NAME
- JIRA_ASSIGNMENT_GROUP
- Subscriptions
These properties and values will be used in the JIRA REST API calls to create and update JIRA Incidents.
Log Analytics Workflow
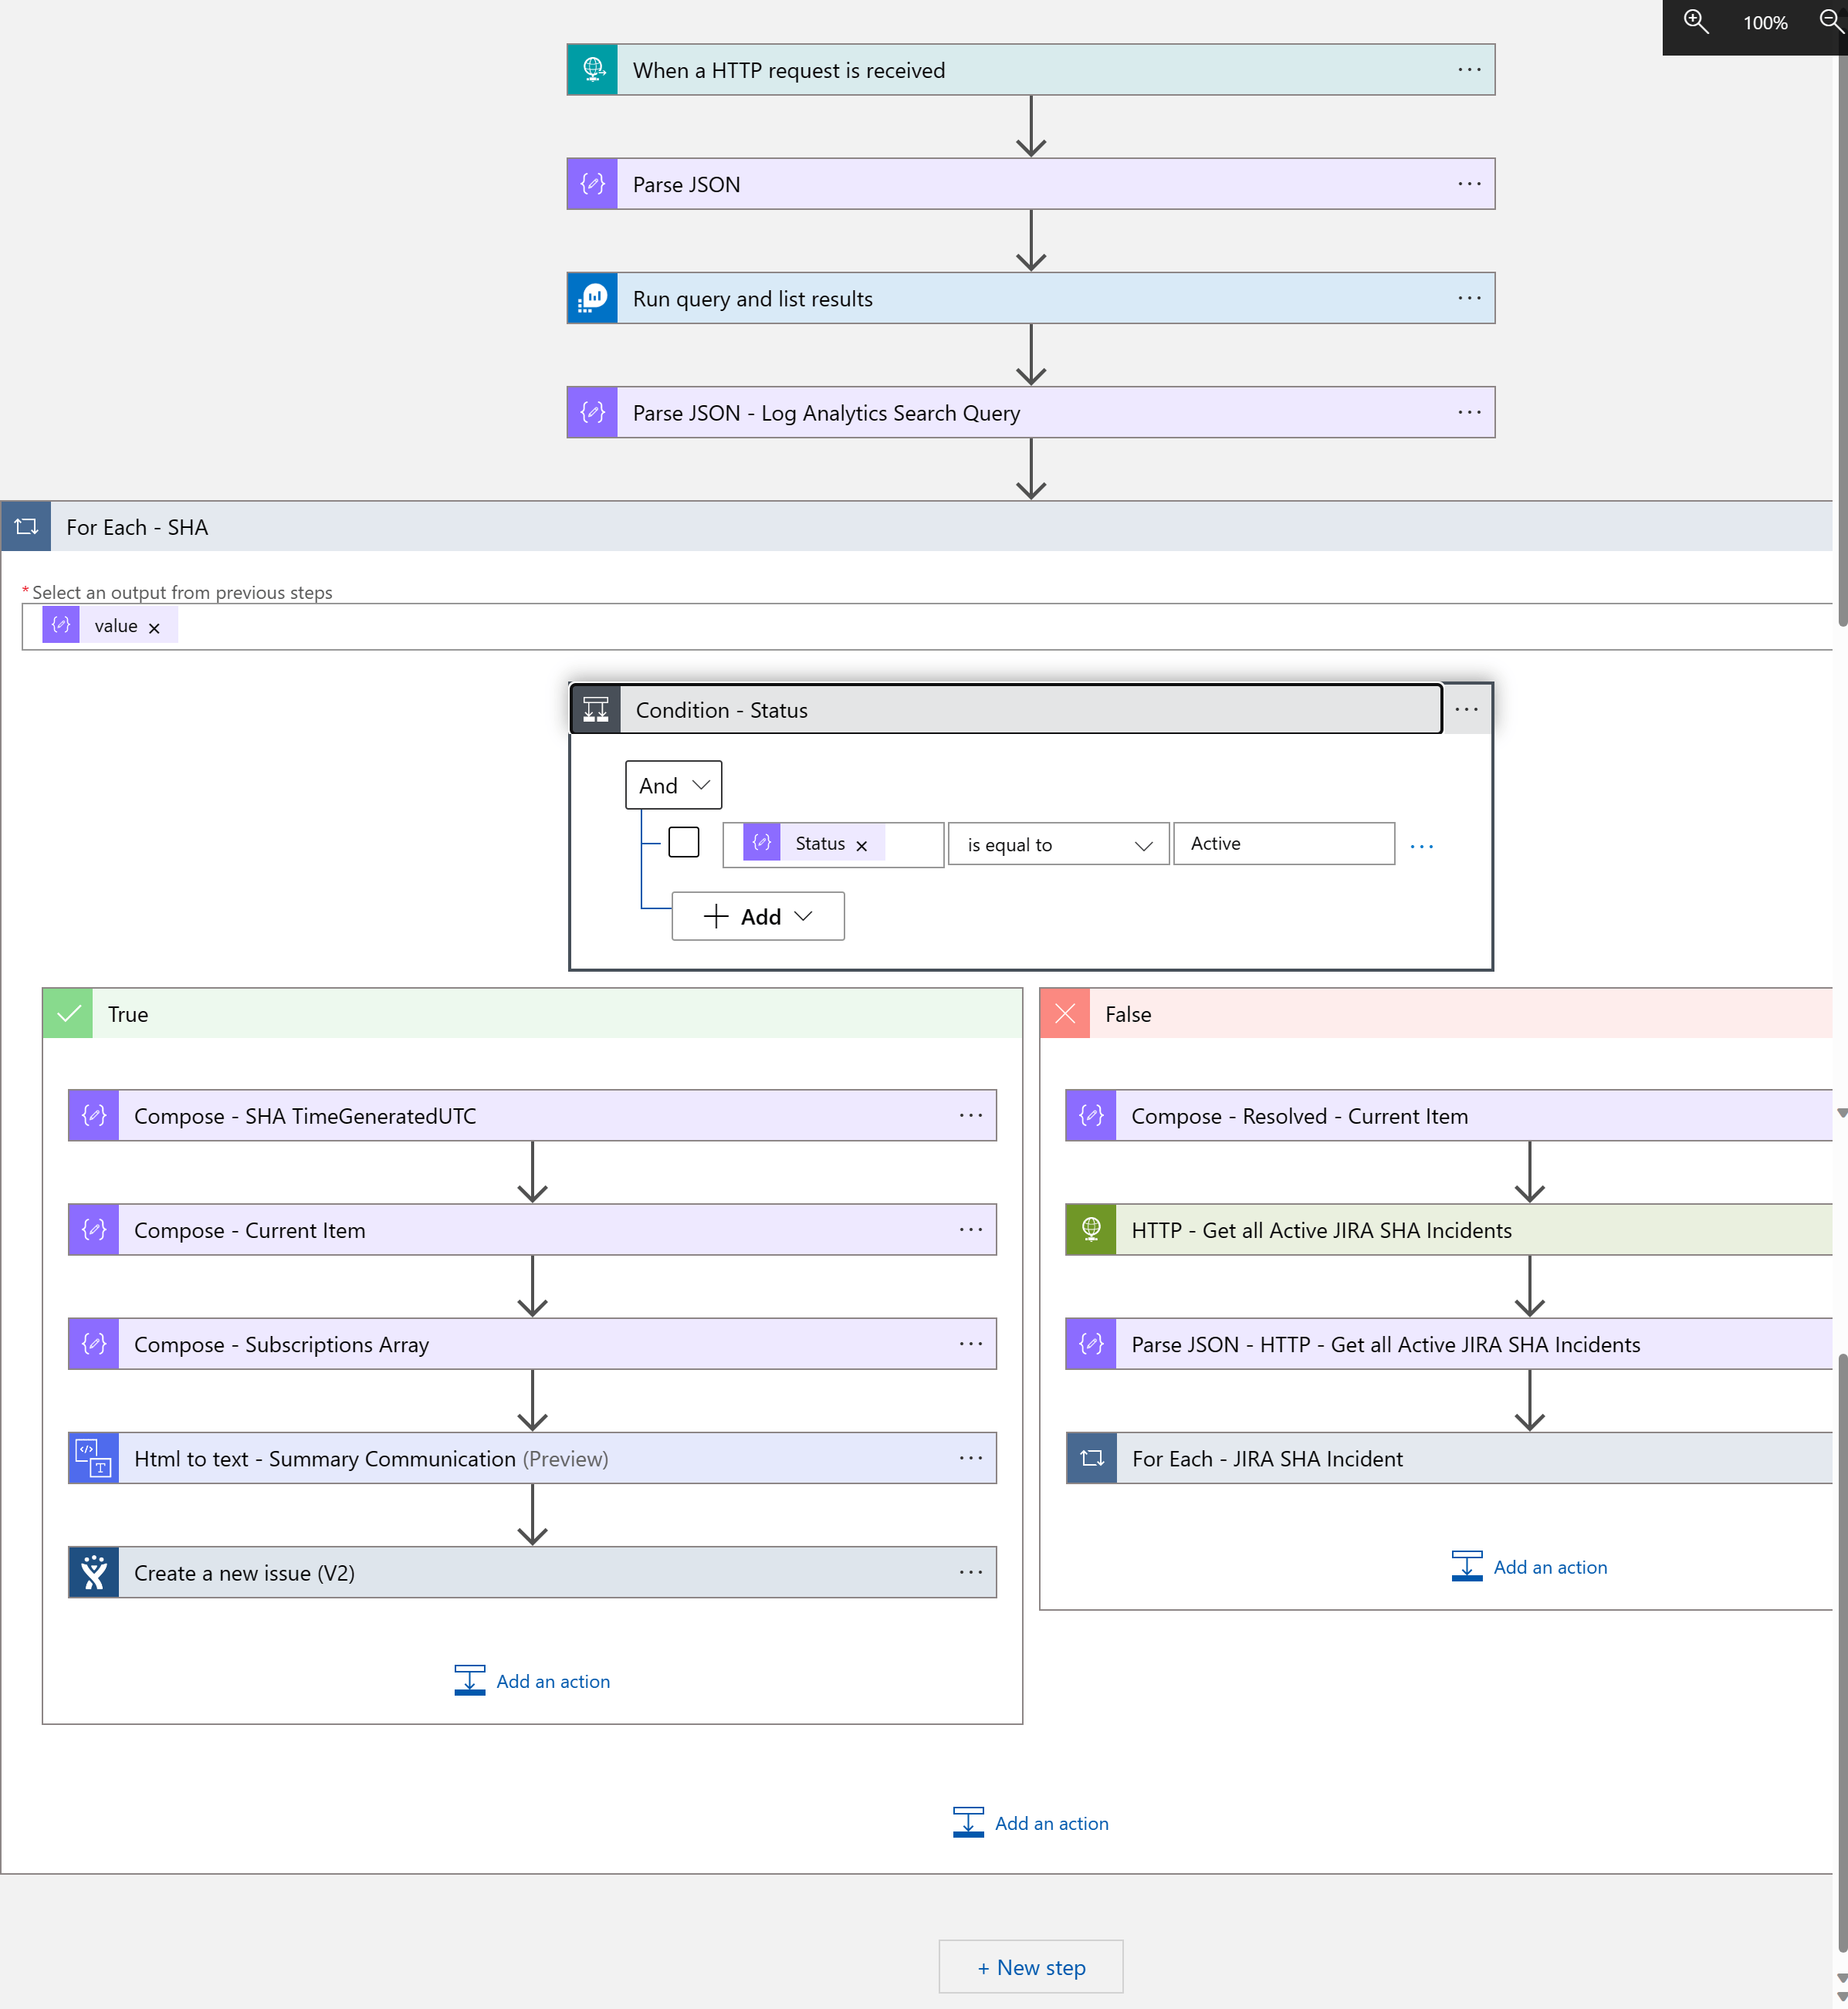
The following Log Analytics Workflows is being used to create and resolve JIRA Incidents for Azure Service Health Alerts
Let’s get into some of the more detailed steps of the Logic App Workflow.
1. Trigger: When a HTTP request is received
The workflow is being triggered via a HTTP request triggered via an Azure Monitor Alert Rule and an Action Group.
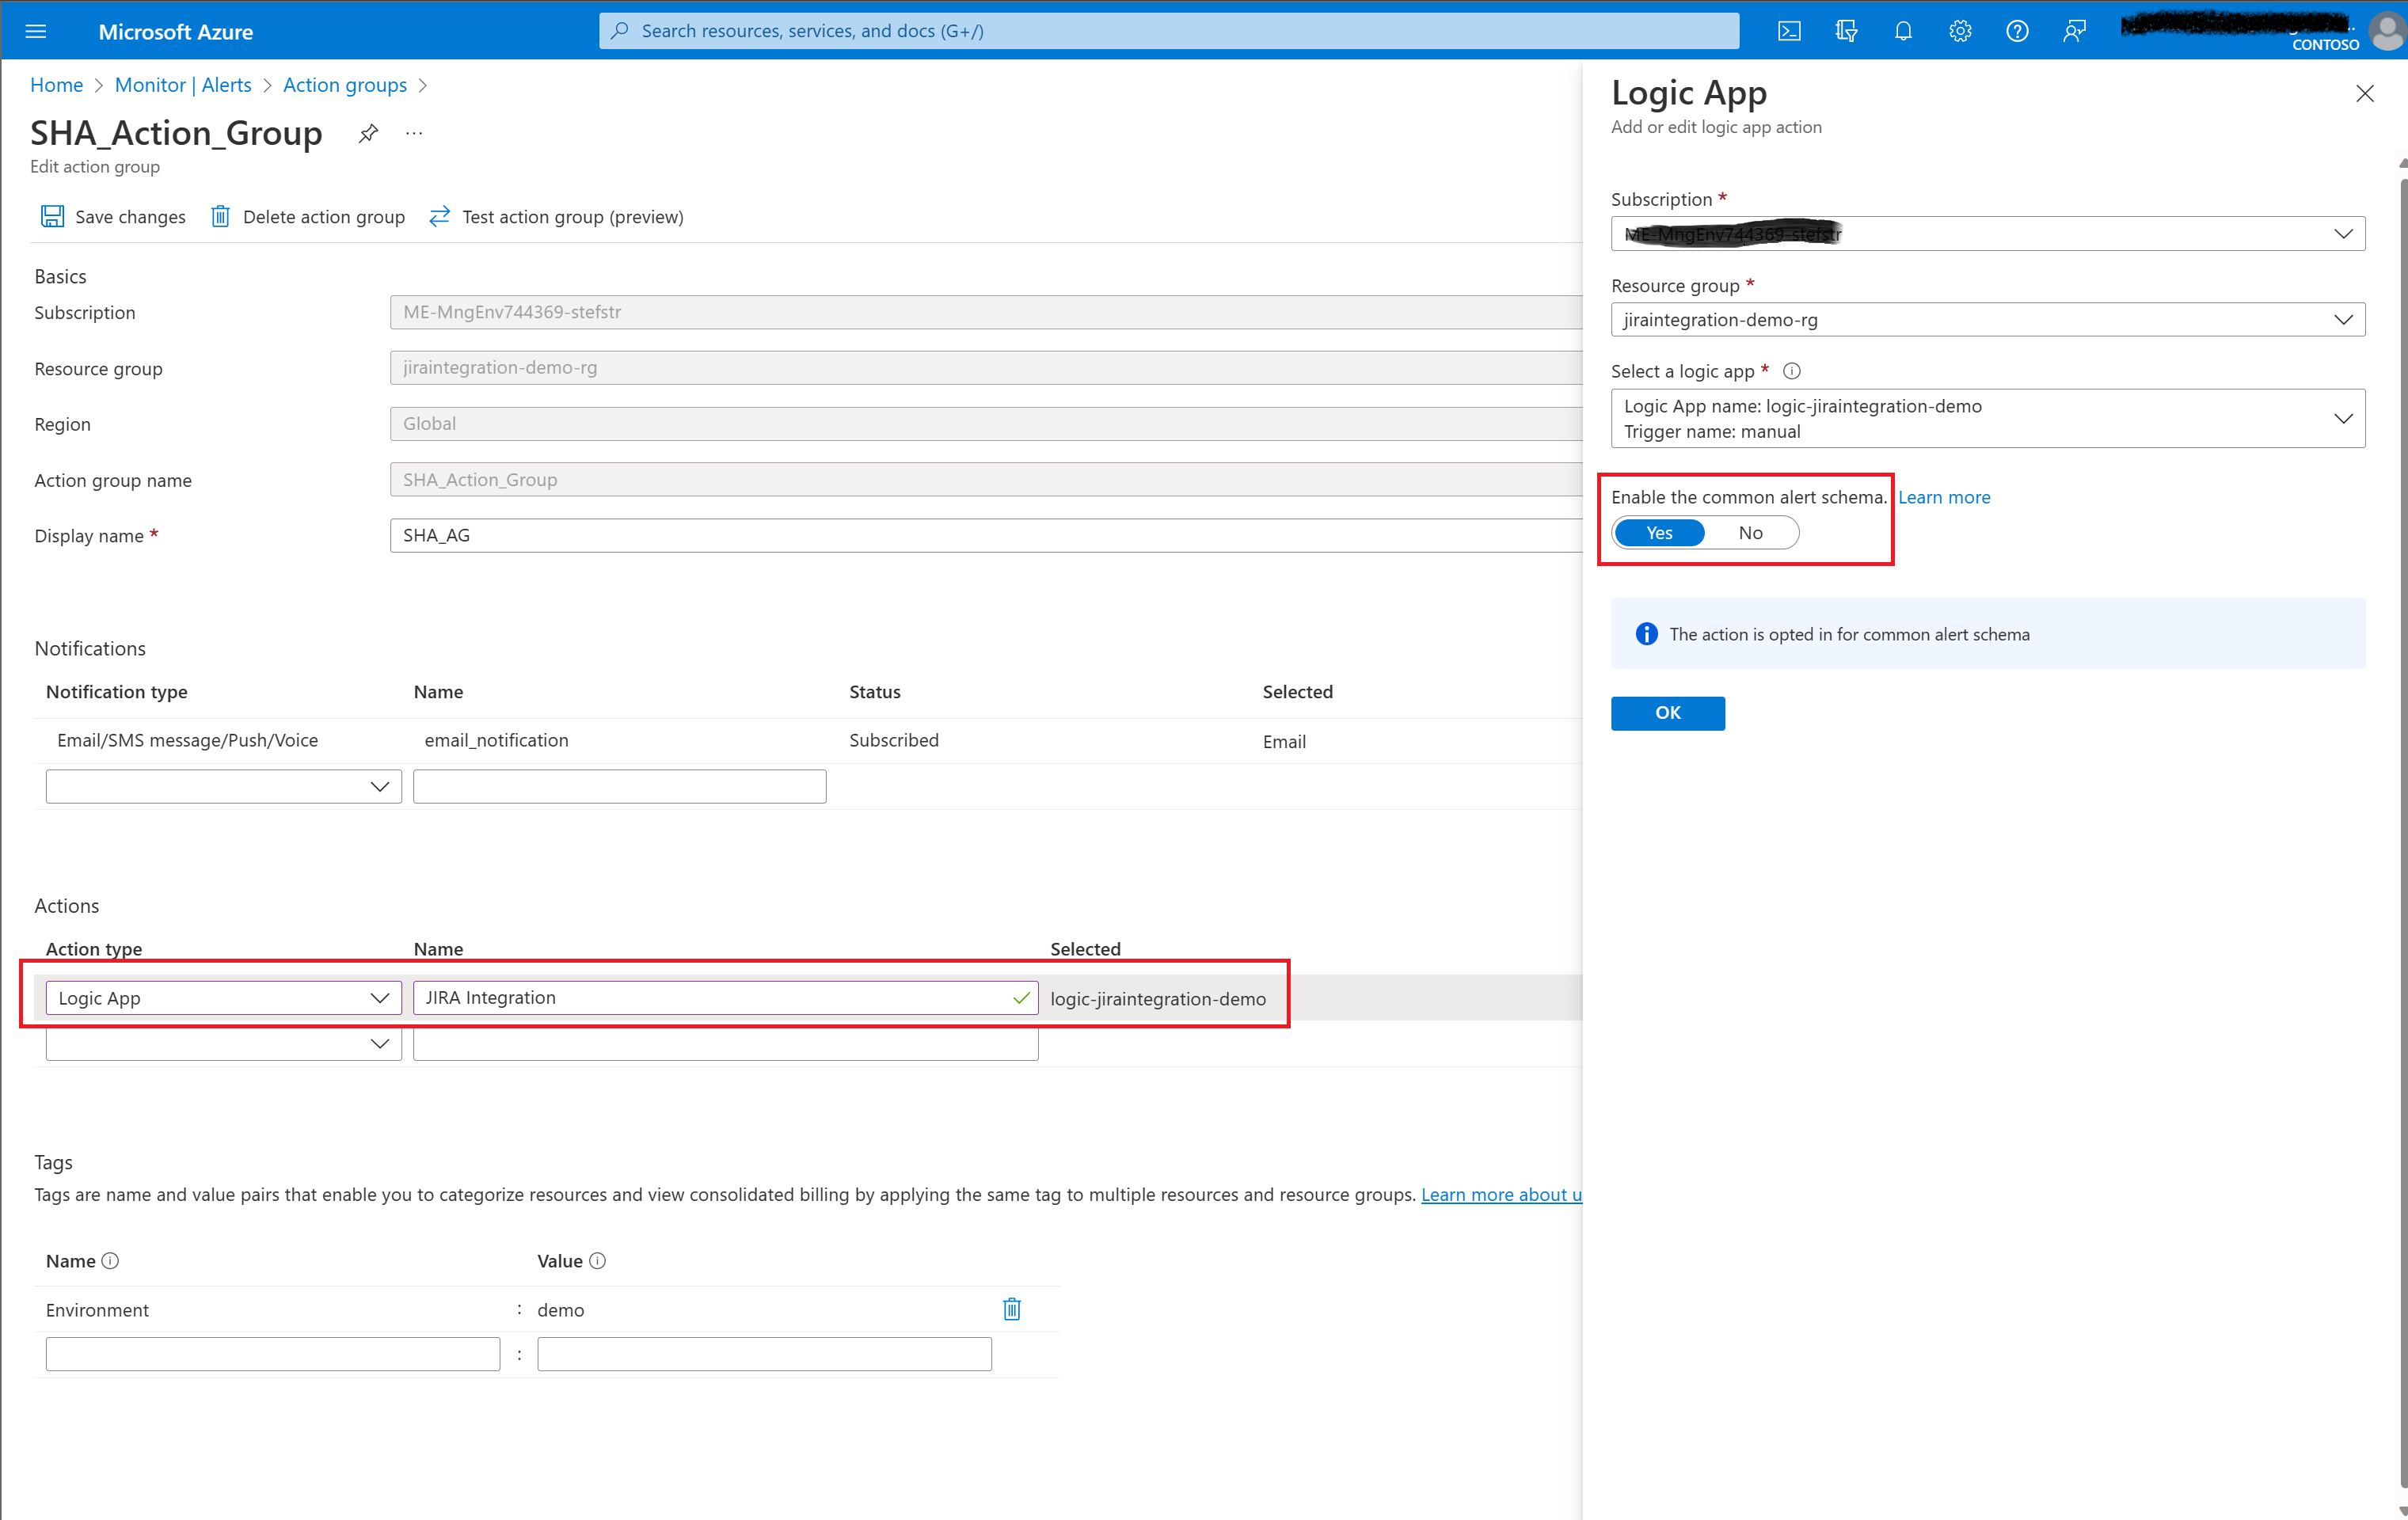
The first step is that you create an Azure Monitor Action Group that triggers the Logic App Workflow.
Make sure you select as Action type a Logic App and select the earlier created Logic App (workflow). Also use the Common Alert schema in the Action Group configuration.
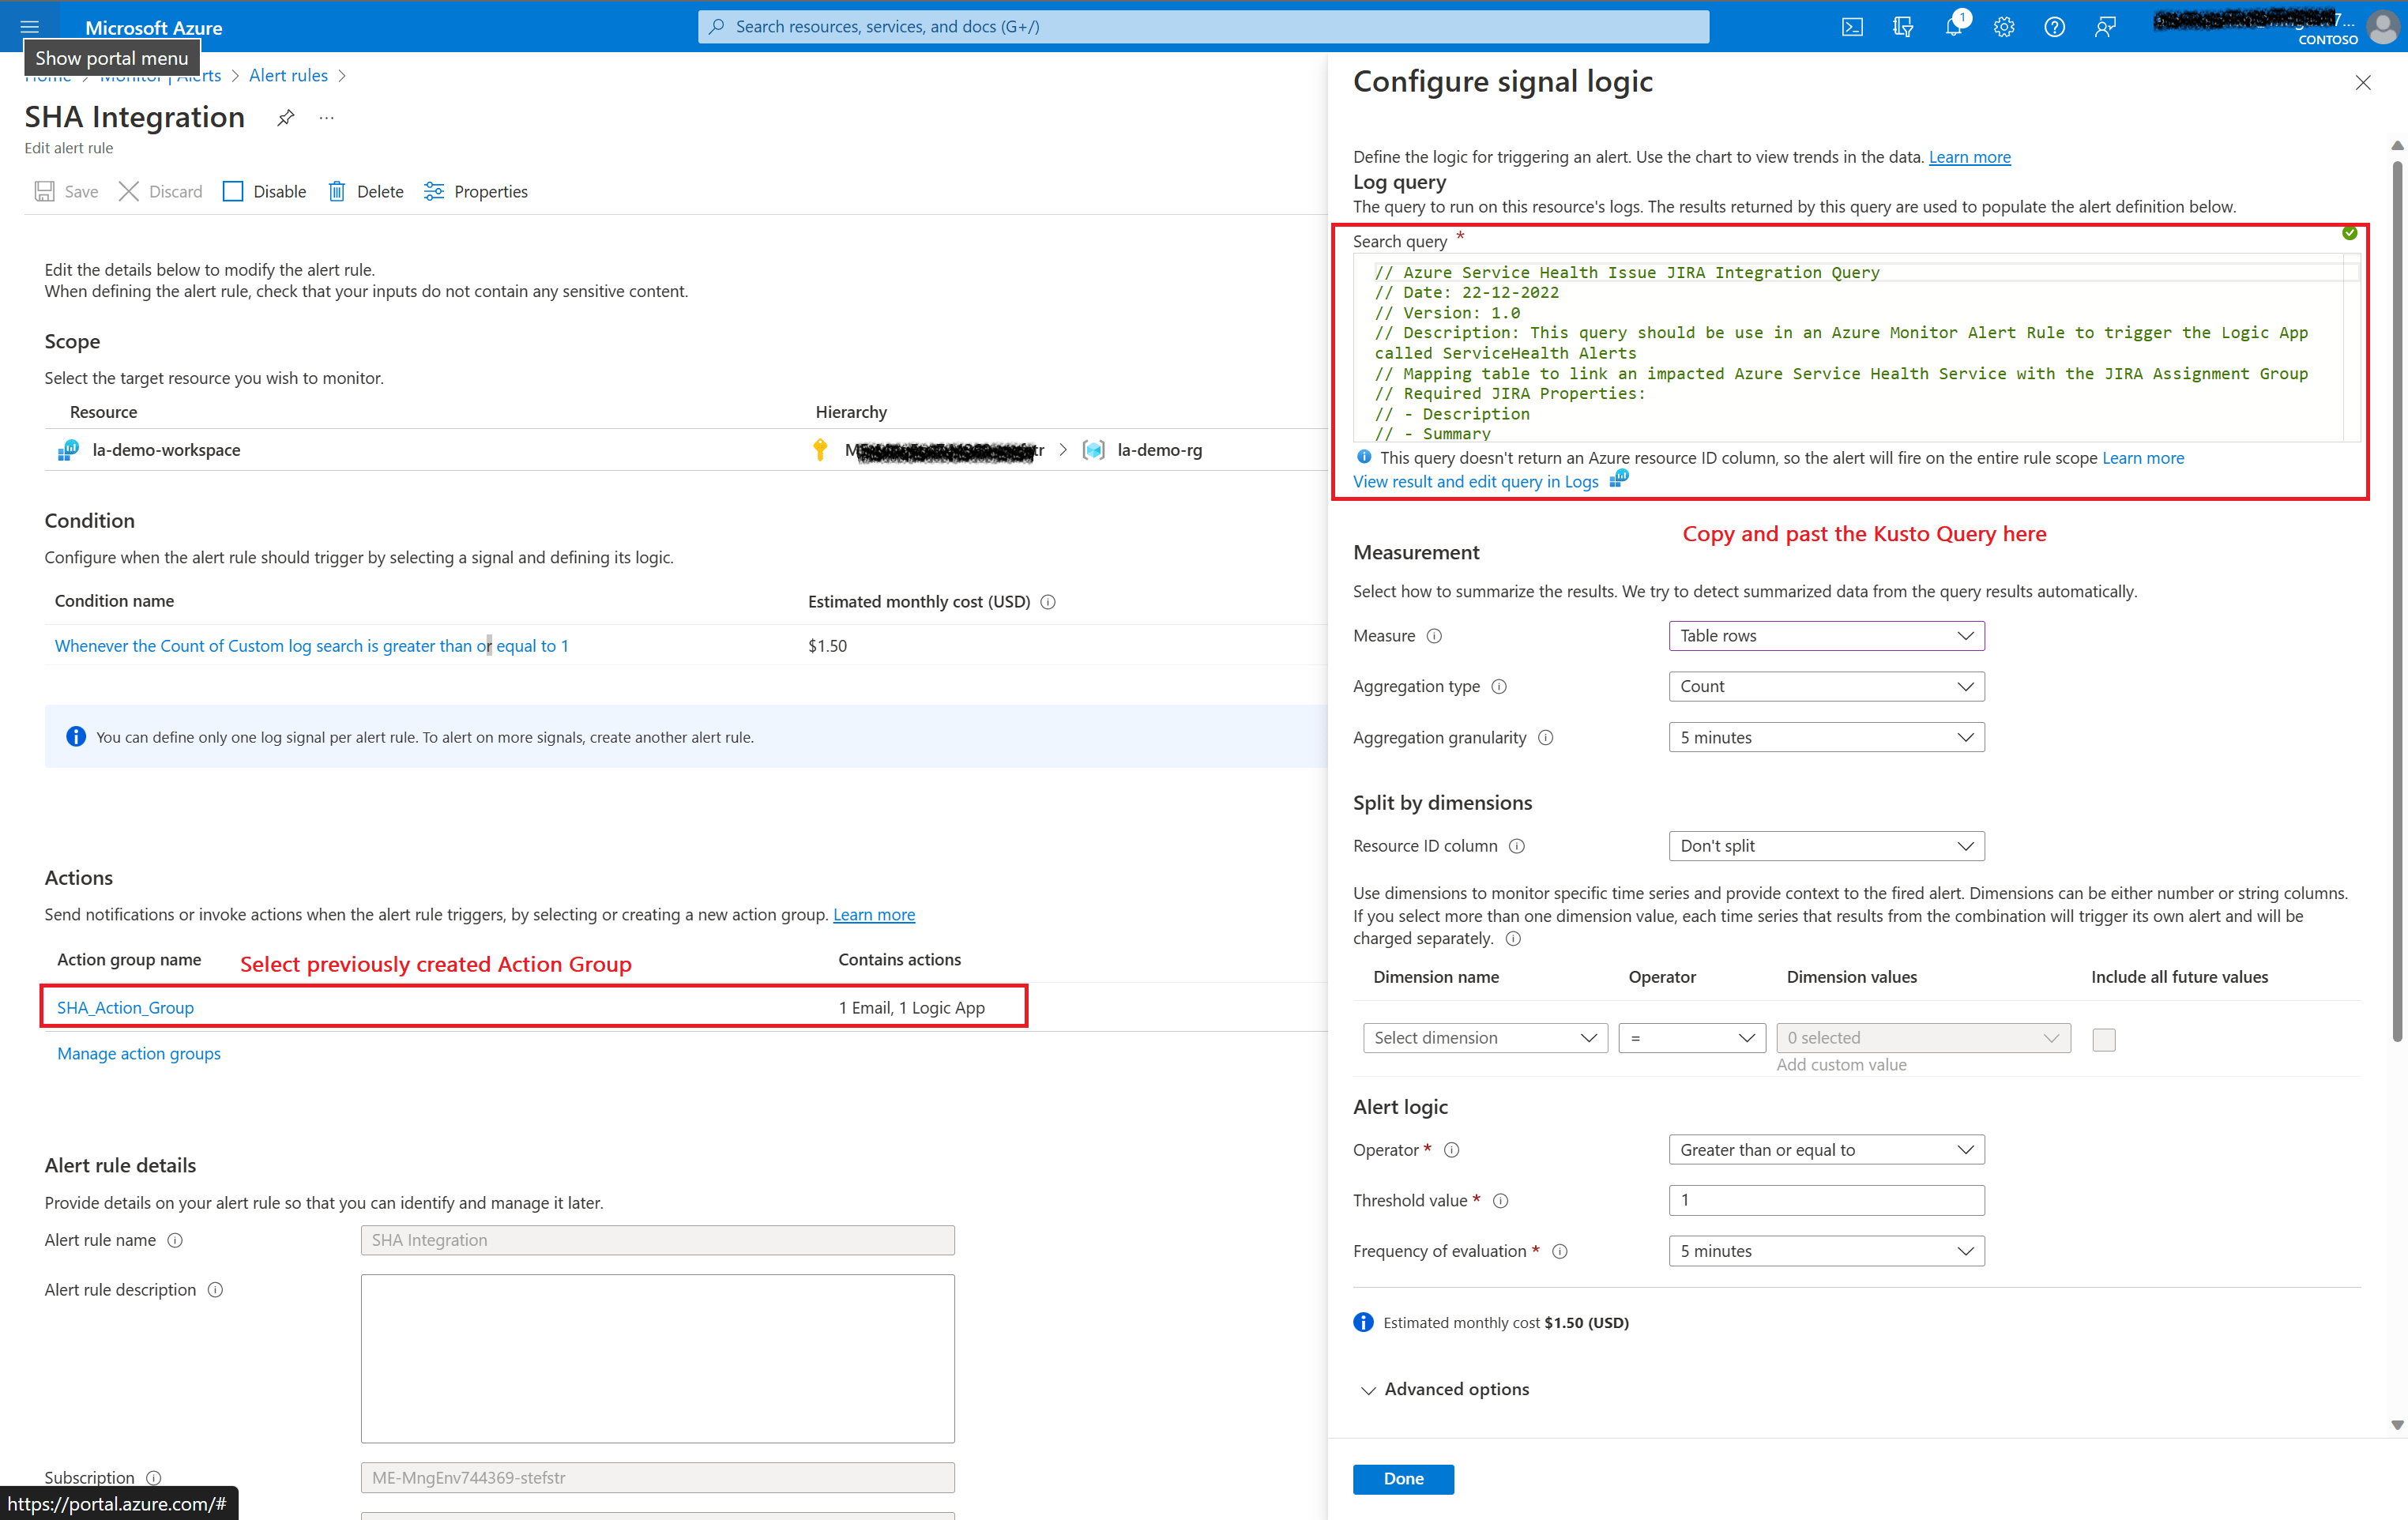
Now you can create the Azure Monitor Alert which will be used by the Azure Monitor Action Group to trigger the Logic App.
Now all the pre-requisites are available to have the Logic App Workflow being triggered when ever the number of records created by the Kusto query are equal to or greater then 1.
3. Run query and list results
This step uses the Azure Monitor Logs Logic App Connector.
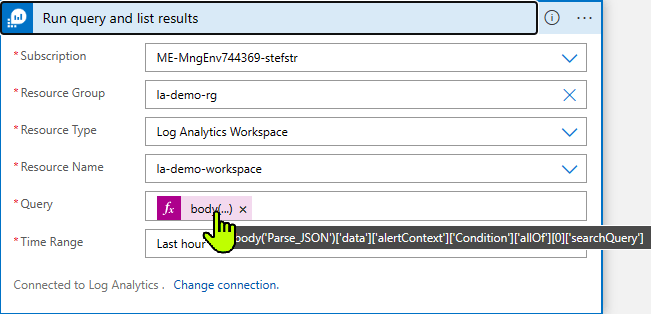
For the query to be run we are using the Kusto query configured in the Azure Monitor Alert which was passed as a body to the Trigger: When an HTTP Request is received.
1
body('Parse_JSON')['data']['alertContext']['Condition']['allOf'][0]['searchQuery']
5. For Each - SHA
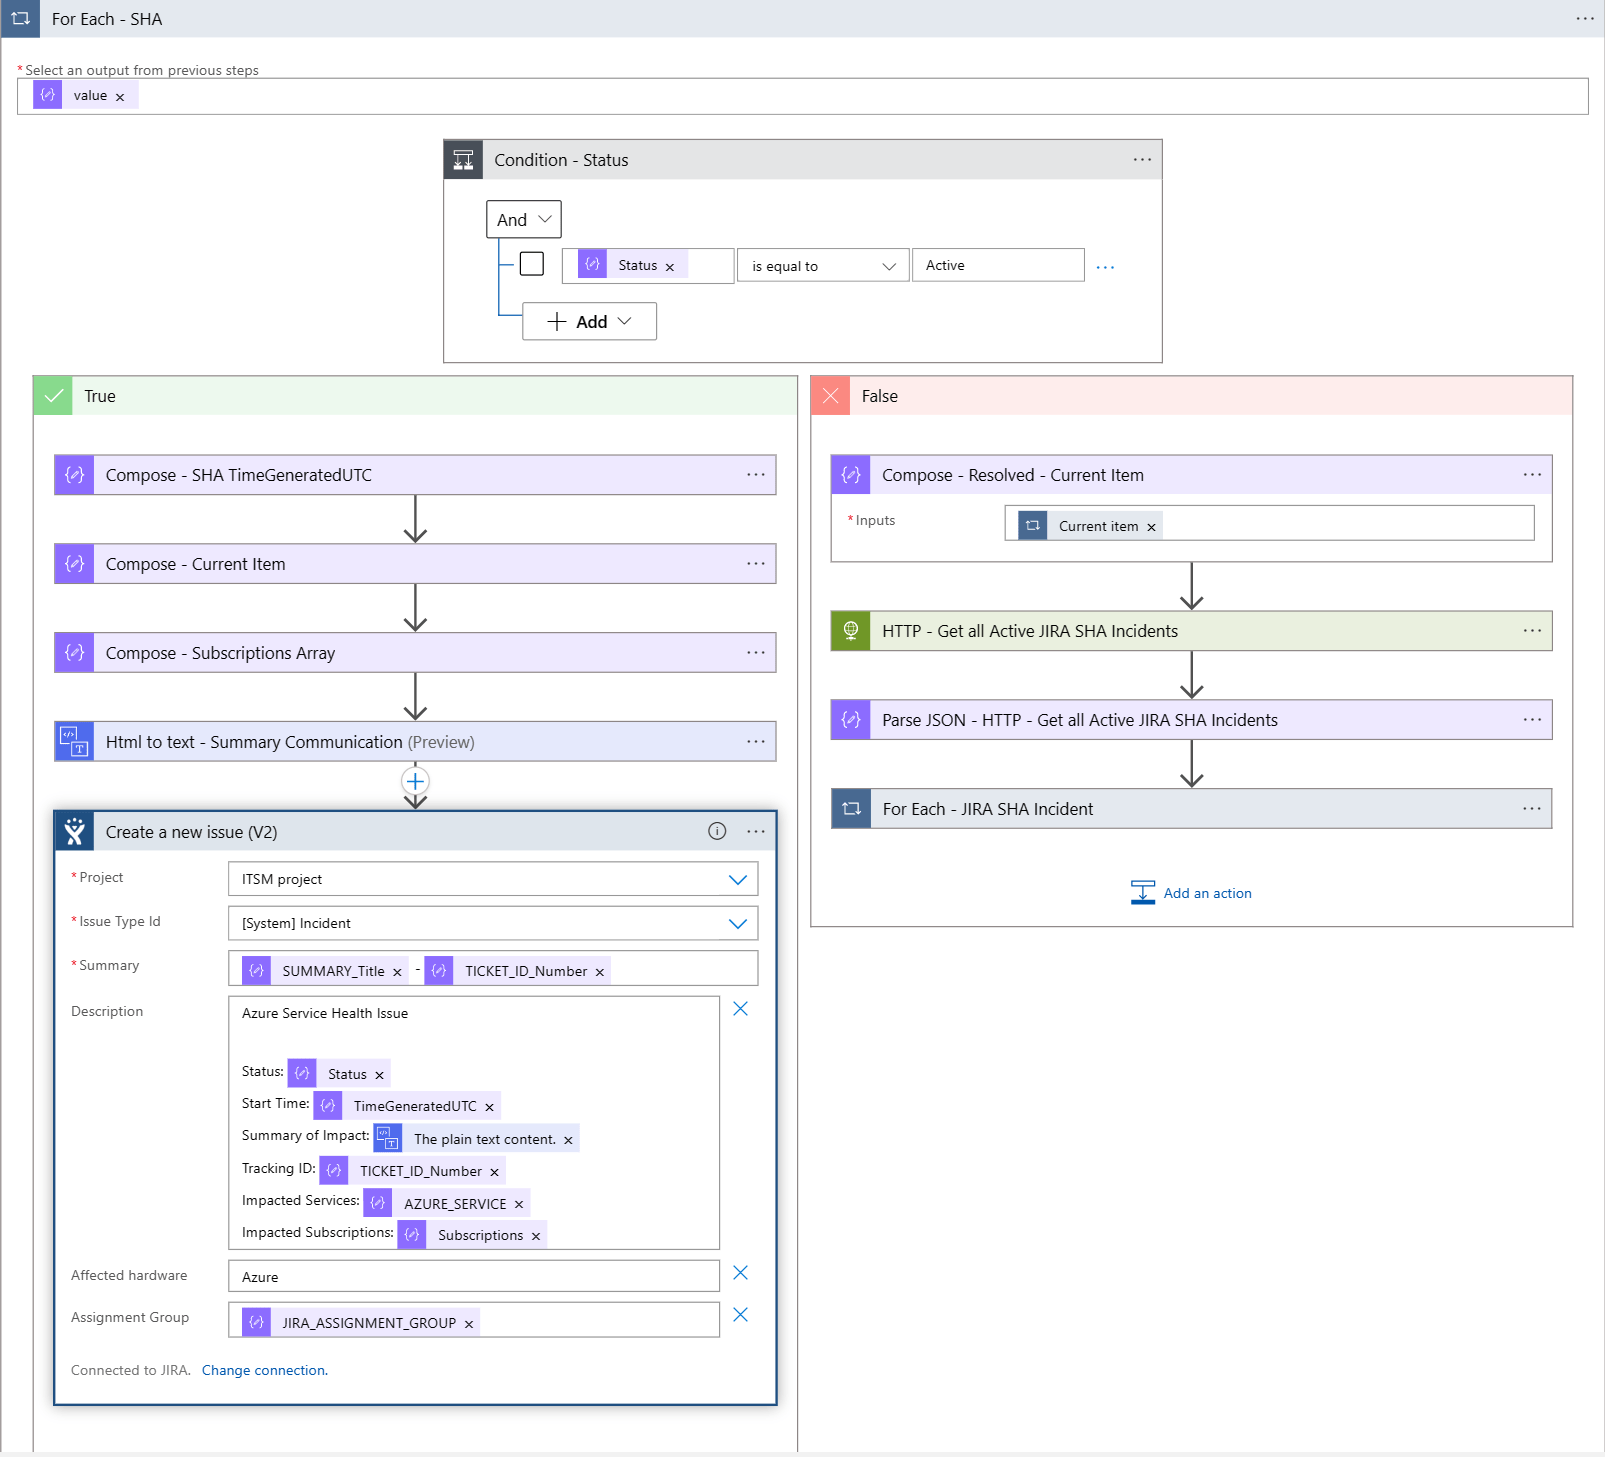
In this step we are iterating through the number of Azure Service Health Issues (records returned from the Kusto Query). It could be that there are multiple records being returned.
Within the For Each - SHA step there is also a Condition added to check the Status of the Azure Service Health Issue. If the Status is Active a new JIRA Incident will be created and when the Status is something else, for instance Resolved there will be validations if an existing JIRA Incident can be closed.
For the creation of new JIRA Issue the Create a new issue (V2) Logic App Connector is used.
With the properties and values coming from the Kusto query the body of the JIRA Issue REST API is being made.
The body of the Create a new issue (v2) looks as follows:
1
2
3
4
5
6
7
8
"body": {
    "fields": {
        "summary": "@{items('For Each - SHA')?['SUMMARY_Title']} - @{items('For Each - SHA')?['TICKET_ID_Number']}",
        "description": "Azure Service Health Issue\n\nStatus: @{items('For Each - SHA')?['Status']} \nStart Time: @{items('For Each - SHA')?['TimeGeneratedUTC']}\nSummary of Impact: @{body('Html to text - Summary Communication')}\nTracking ID: @{items('For Each - SHA')?['TICKET_ID_Number']}\nImpacted Services: @{items('For Each - SHA')?['AZURE_SERVICE']}\nImpacted Subscriptions: @{items('For Each - SHA')?['Subscriptions']}",
        "customfield_10041": "Azure",
        "customfield_10065": "@items('For Each - SHA')?['JIRA_ASSIGNMENT_GROUP']"
    }
}
The Custom Field 10041 (Affected Hardware) is used to indicate that the issue is on the Azure Platform and the Custom Field 10065 is used to have a Assignment Group.
When the Status of the Azure Service Health Issue is not Active in the Condition, the right part of the Workflow is being executed.
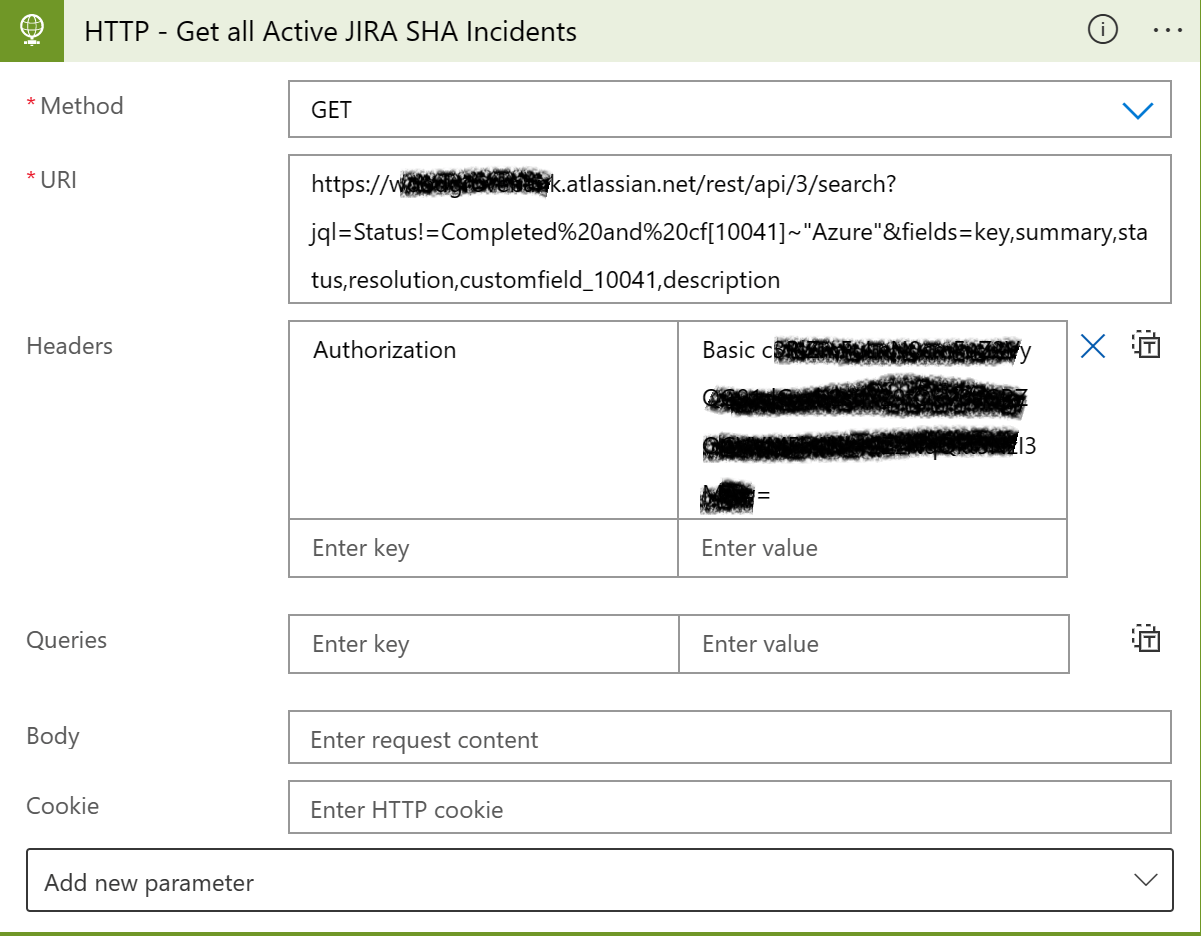
Step HTTP - Get all Active JIRA SHA Incidents will retrieve all current Azure Service Health JIRA issues where the JIRA status is not equal to Completed.
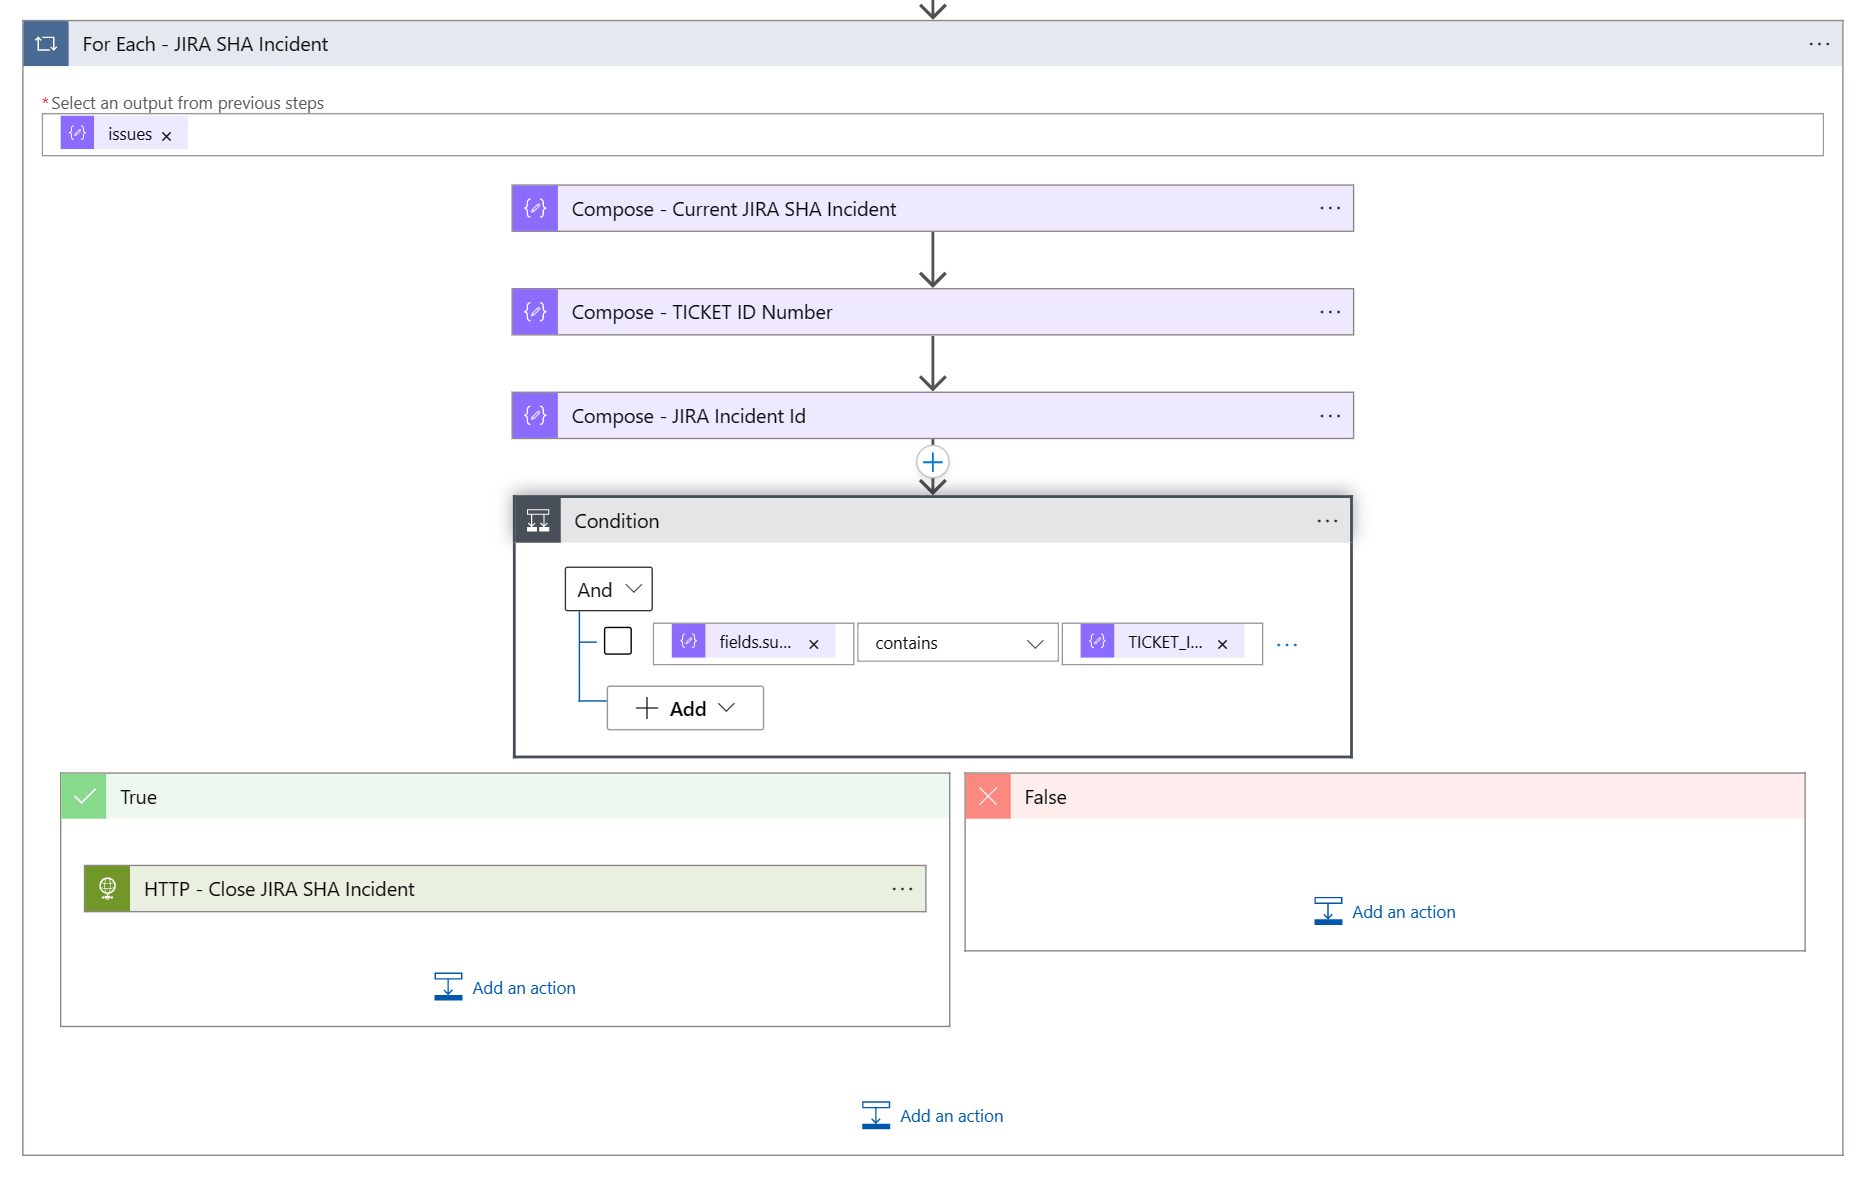
If there are any open JIRA issues each of them will be iterated and checked if the TICKED_ID_NUMBER equals the value of an Azure Service Health Issue that has a status of Resolved.
This logic makes sure that all JIRA Service Health Issues are closed when these are also resolved via the Azure Service Health Issue updates.
Hope this blog post gave you some ideas on how to use Logic Apps to integrate Azure Service Health Issues with JIRA issues.
FAQ
Here some answer to the Frequently Asked Questions you might have.
Why don’t you use the out-of-the box Logic App JIRA Connector?
This Connector has limited properties that can be configured to create the JIRA ticket.
